#TheKerlaStory: Investigating the Rise, Discussions and Manipulation of Socio-Political Trends on X (Twitter) In India
Introduction
On May 5th, 2023, 'The Kerala Story,' a film released in India, stirred significant controversy due to distorting facts and targeting certain communities and regions in the country. Widely perceived as a propaganda film, it garnered applause particularly from right-wing leaders across the nation. The situation took a more drastic turn on May 8th when the Prime Minister himself endorsed the film, sparking a surge in discussions and debates. Notably, several keywords related to the movie began trending on the social media platform X.
This sudden spike in discussions coincided with three adverse events for the ruling party: 1. The ongoing legislative assembly elections in Karnataka. 2. The wrestlers' protest against the incumbent sports minister, Mr. Brij Bhushan Singh, who faced multiple allegations of sexual assault. 3. The Civil unrest in Manipur, where the government had imposed an internet shutdown on May 6th.
This project was undertaken to delve into the possibility that the surge in discussions around this propaganda movie might have been strategically manipulated to divert attention from these unfavorable events. By examining the data and trends, we sought to shed light on this intriguing aspect of contemporary discourse
Identifying topics discussed in mainstream media
To assess the prominence and efficacy of these discussions in diverting attention from the other events, I conducted an analysis of tweets from two influential Indian news media outlets, namely Times Now and AajTak. By collecting tweets from these sources over the course of a month, I generated word clouds to facilitate a rapid assessment of the primary topics under discussion. This approach allowed for a swift and insightful analysis of the prevailing discourse.
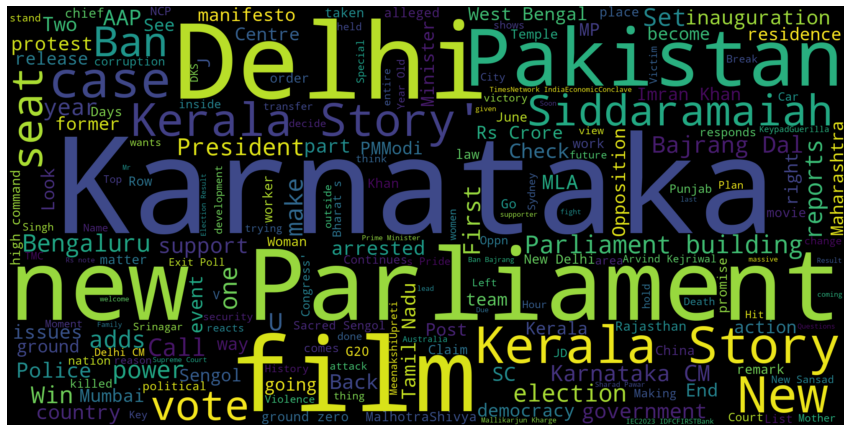
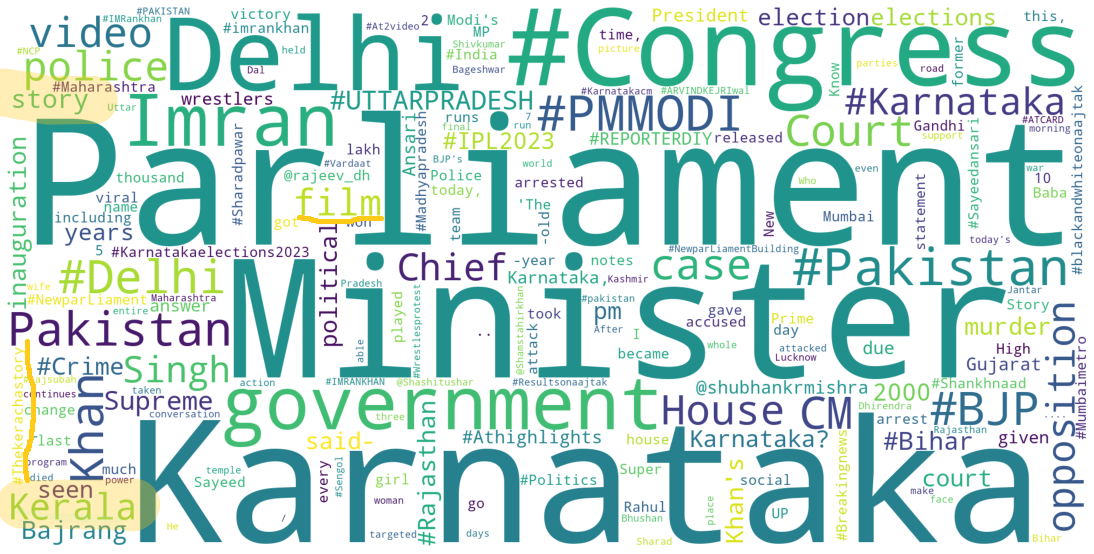
While analysing the two word clouds, common themes emerge, including discussions on Karnataka's elections and the Parliament. The Karnataka elections, marked by intense campaigning and significant media coverage, naturally led to increased online discourse, with keywords like Karnataka, Siddaramaiah, and chief minister featuring prominently. Additionally, the inauguration of India's new parliament building garnered substantial media attention. Notably, "The Kerala Story" appeared in both discussions, with clearer prominence in the Times Now word cloud. Beyond mainstream media discussions, the two significant events: the wrestlers' protests against the sports minister facing sexual assault allegations and the civil unrest in Manipur, marked by an internet shutdown and disturbing incidents received limited attention. Intriguingly, these events were somewhat eclipsed by discussions related to the film 'The Kerala Story,' raising questions about the prioritization of topics in media discourse, particularly when minority group protests and critical issues are involved.
Detecting manipulation in the discourse
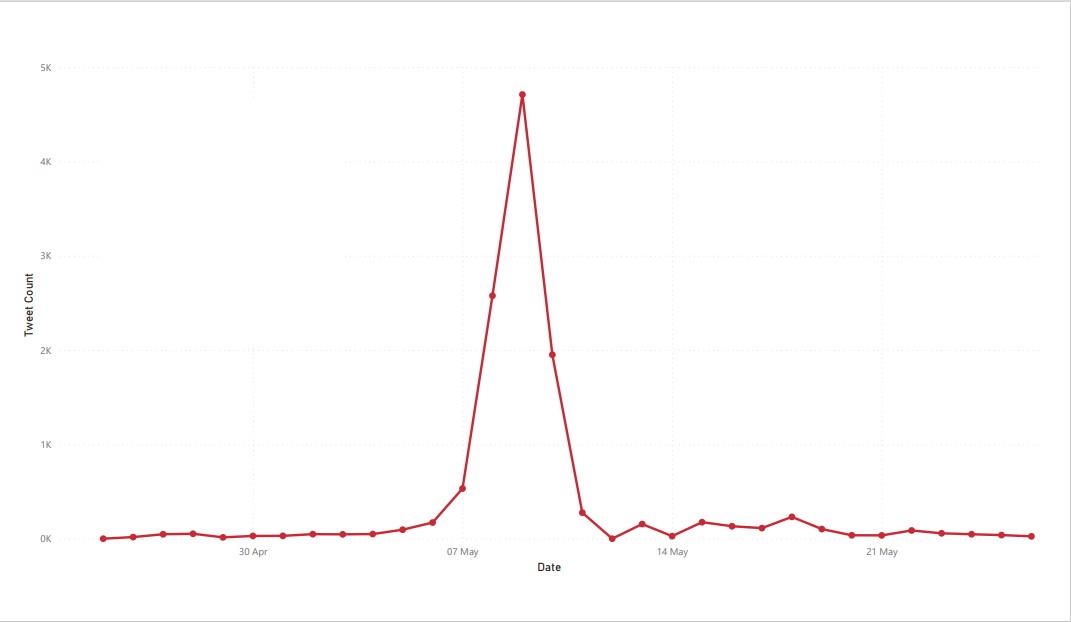
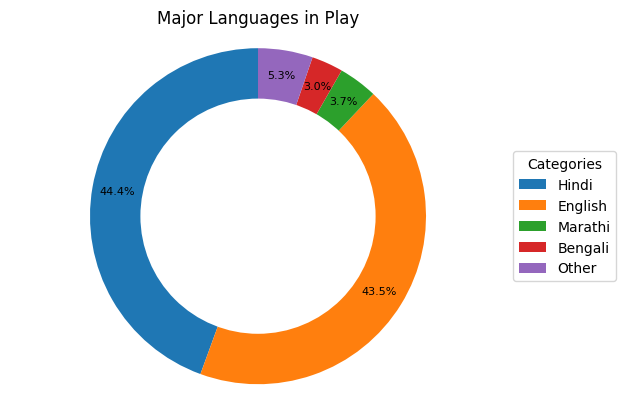
In early May, particularly after May 5th when the Prime Minister of the country integrated a movie into his political campaign, numerous keywords related to the movie started trending on social media platform X. To identify these trending keywords, we utilized an online resource called the Twitter Trending Archive. Given the limitations of the project only one trend was picked to be analysed: #TheKerlaStory for which we were able to scrape 12,272 tweets containing the keyword. A time series graph illustrated a sudden surge in posts starting on May 6th, 2023. This spike could be attributed to the movie's release on May 5th and the Prime Minister's campaign on the same day. We also examined the languages used in these discussions, revealing a diverse array with Hindi, English, Marathi, and Bengali being predominant.
Furthermore, I investigated the possibility of trend manipulation using a metric called the Coefficient of Traffic Manipulation (CTM). The CTM metric proposed in a 2019 research paper, made use of the following metrics such as the ratio of retweets in the total dataset, the percentage of tweets from the most active 50 users and the average posts per user. I implemented the metric to the dataset of tweets I collected and the CTM value for #TheKerlaStory was calculated to be 18.49, surpassing the lower limit of CTM values found for manipulated trends in previous studies. The values for the other parameters are listed in the table below.
| Overall | |
|---|---|
| Average Posts per Users | 1.53 |
| Retweets Ratio/10 | 8.6 |
| Top 50 post proportion | 8.54 |
| CTM | 18.49 |
Sentiment Analysis and Stance Detection
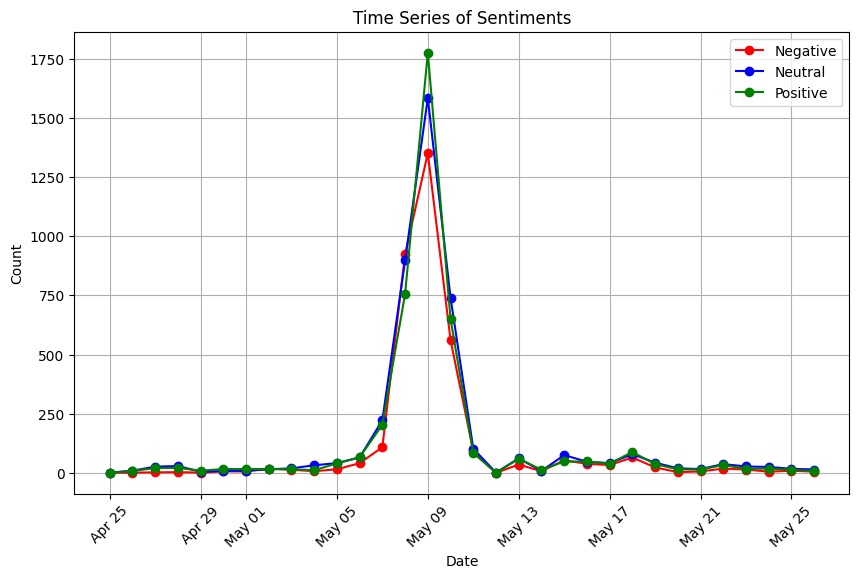
The analysis of tweets involved assessing sentiment and polarization levels in the discourse. A time series graph displayed the results of sentiment analysis using VADER, revealing the presence of positive, neutral, and negative sentiments, with no clear dominance. However, it was observed that a higher number of tweets were exhibiting positive sentiments.
Stance Detection - Fine tuning BERT models
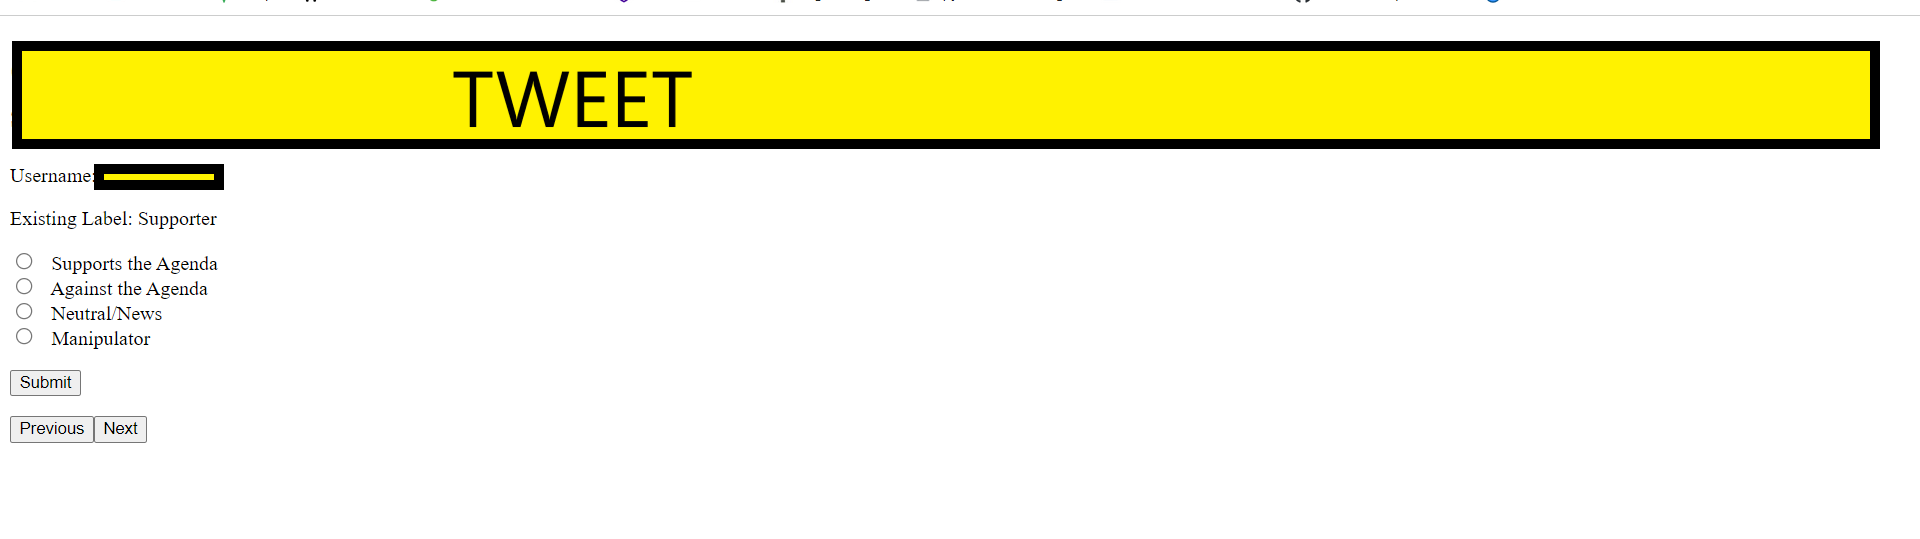
Conventional sentiment analysis proved insufficient for assessing the polarization levels in the discourse. To delve deeper into this aspect, I leveraged two NLP models, BERT and BERTweet, for stance detection. However, implementing this required fine-tuning these models on my training dataset, which involved labeling the stance of 1200 tweets. To facilitate the labelling process, I designed a user-friendly interface where I could easily assign a tweet's stance through a simple button click, as depicted in Figure 6. The tweets were categorized into one of four stances: Supporter, Against, Manipulator, or Neutral. The results of the annotation process unveiled a notable bias towards the discussed topics.
| Precision | Recall | F1-Score | Support | |
|---|---|---|---|---|
| Supporter | 0.822 | 0.718 | 0.767 | 135 |
| Against | 1 | 0.125 | 0.222 | 16 |
| Manipulator | 0.53 | 0.765 | 0.626 | 34 |
| Neutral | 0.442 | 0.704 | 0.543 | 27 |
| Accuracy | 0.679 | 0.679 | 0.679 | 0.679 |
| Weighted Average | 0.74 | 0.679 | 0.674 | 212 |
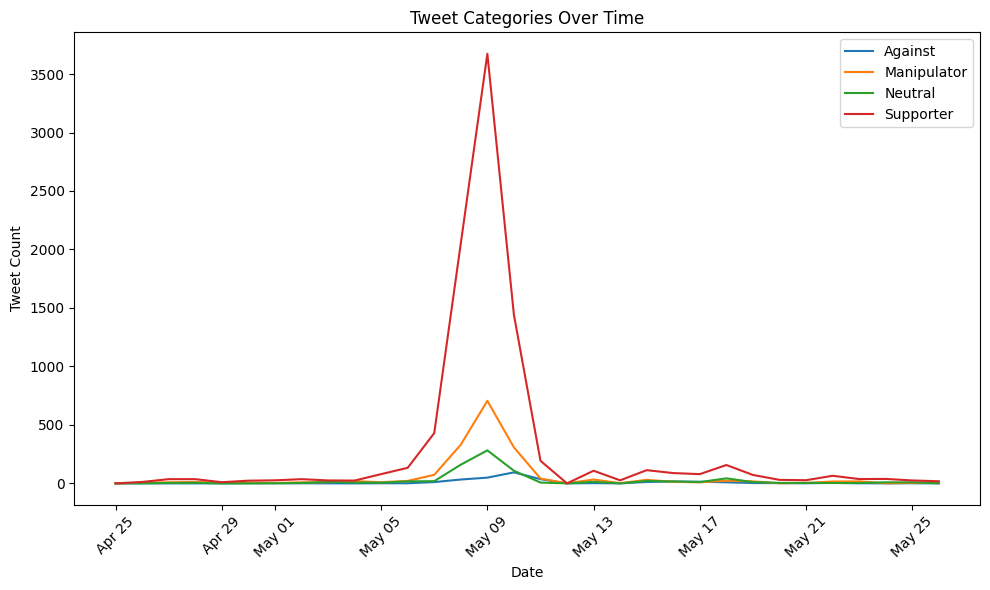
The findings suggested that the models were good in identifying supporter stances due to the abundance of supportive tweets. However, they struggled with minority classes. Imbalanced datasets posed a limitation, and cost-sensitive learning approaches may be needed in the future. The BERTweet model, fine-tuned on labeled data, was then applied to the parent dataset of unlabelled tweets to analyze stances. The results were visualized in a time series graph, shown in figure 7, highlighting the one-sided nature of the discourse, with supporters of the agenda overshadowing those against it. Manipulator accounts played a role in amplifying trends, although their classification was solely based on content analysis, lacking additional user details analysis.
Analysing the topics dicussed by each group
Using the predicted labels, the content shared by users belonging to each of the four groups is examined through word clouds based on their exhibited stance. Figure 8 displays the content posted by users supporting the trend and the movie. Notable elements include various spellings of the movie's name, mentions of the state of West Bengal, and keywords related to women's safety, such as 'daughter,' 'sister,' and 'girl.' Discussions on tax exemptions in certain states and religious references ('Hindu' and 'Muslim') are also present, along with terms like 'truth' and 'reality,' which amplify claims that were debunked. Figure 9 presents word clouds for tweets from users classified as against the agenda. Prominent terms include 'propaganda,' 'lie,' 'hatred,' and 'false,' reflecting the critical stance taken by these users.
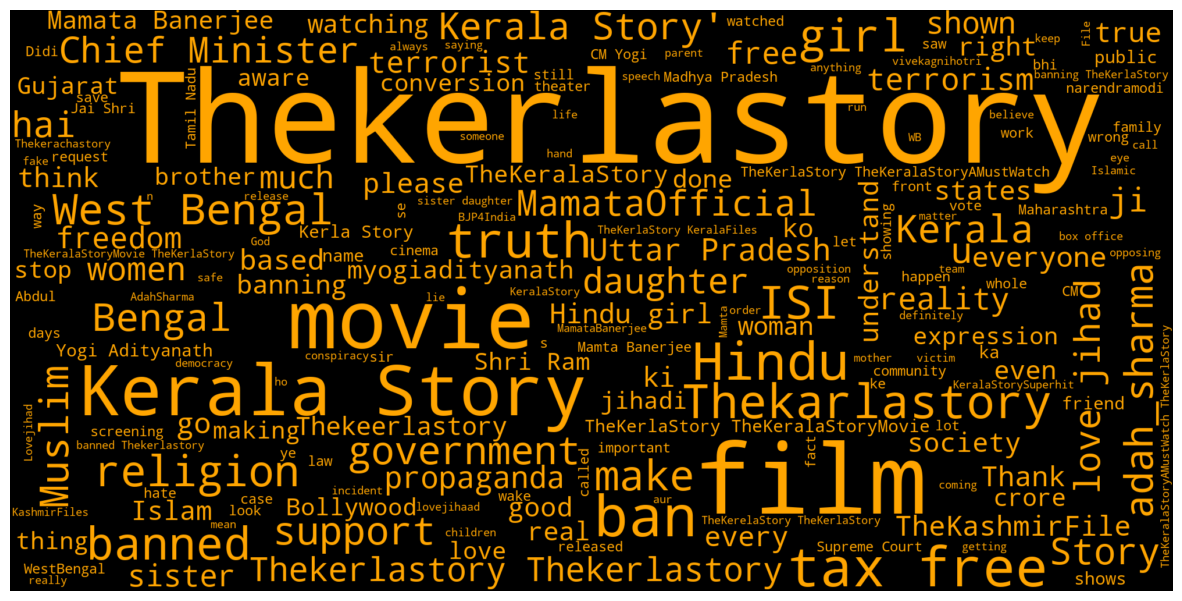
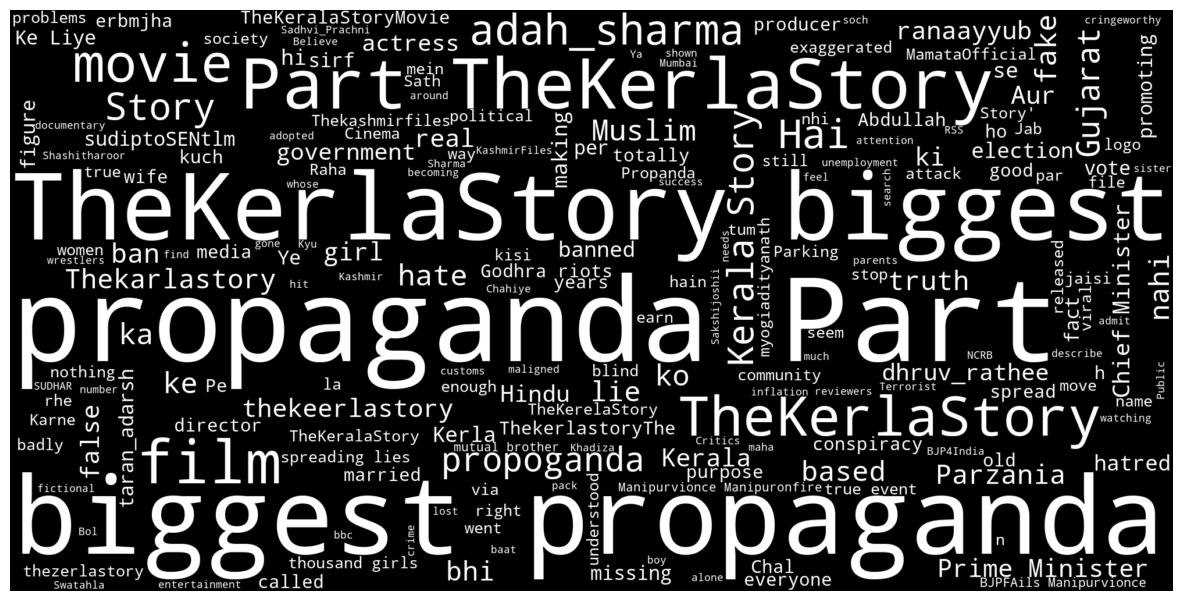
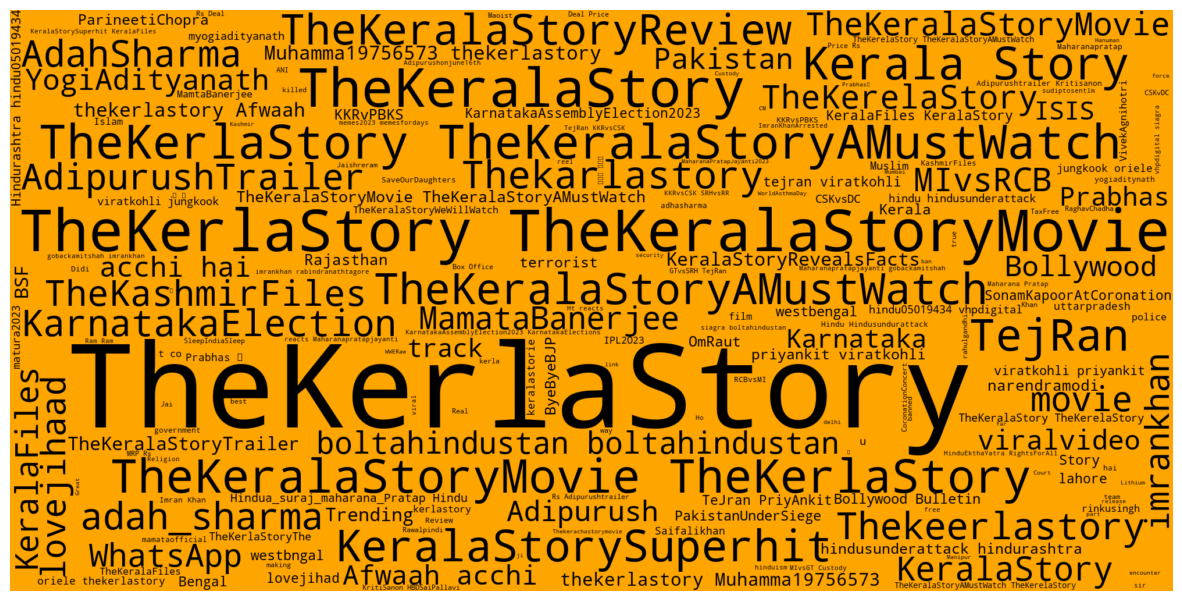
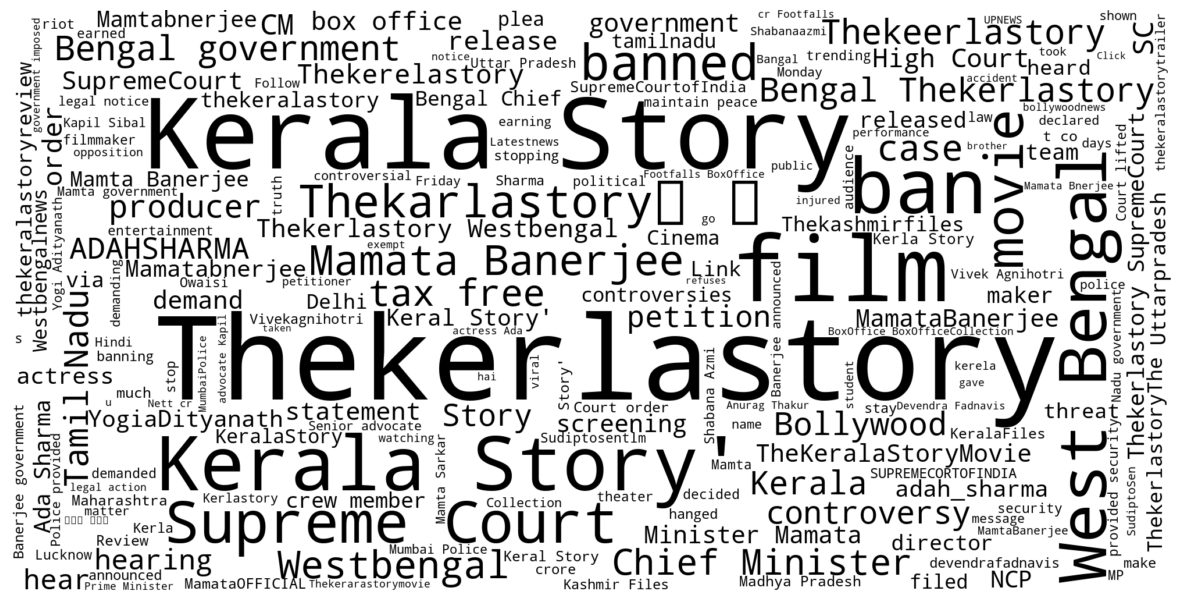
Figure 10 showcases the word cloud for tweets labelled as manipulators. Notably, this word cloud features numerous hashtags and unrelated terms such as 'KarnatakaElection,' 'MIvsRCB,' 'AdipurushTrailer,' and unrelated celebrity names like 'Prabhas' and 'ViratKohli.' Finally, Figure 11 presents the word cloud for neutral tweets, including posts from news outlets. This cloud highlights discussions related to the West Bengal ban, the movie's tax-free status in certain states, and the Supreme Court's rulings regarding the movie.
Stance detection over conventional sentiment analysis techniques
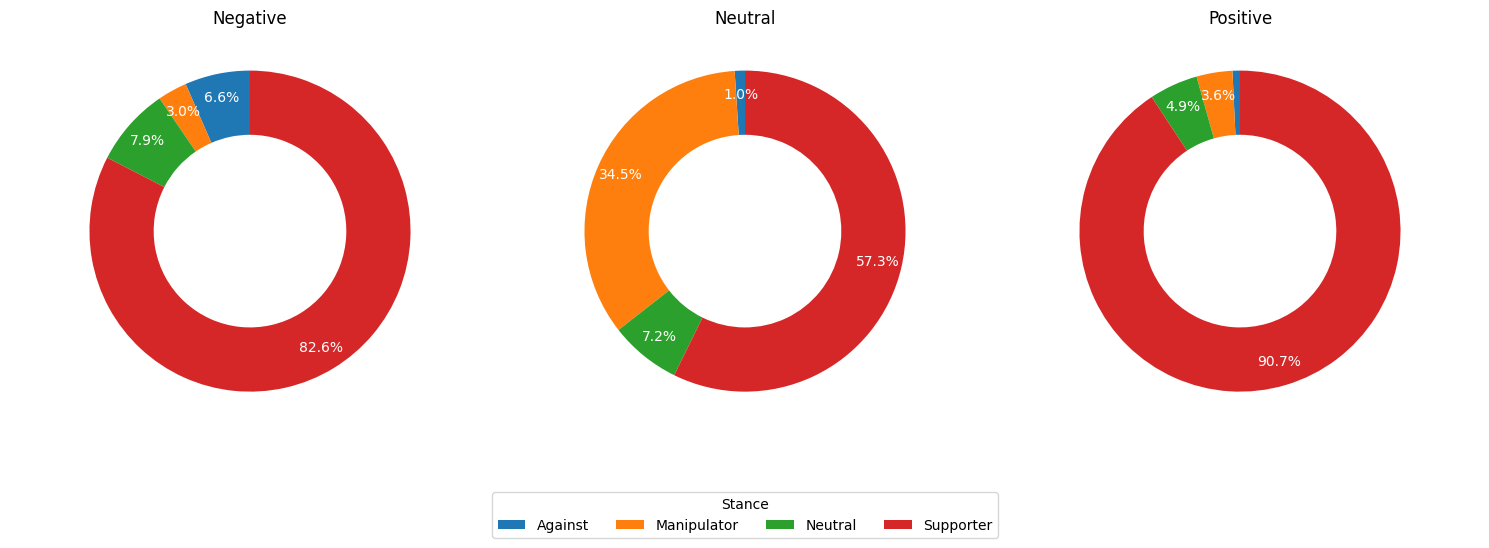
Stance detection surpasses conventional sentiment analysis when analyzing politically charged or sensitive topics. The limitations of traditional sentiment analysis techniques were demonstrated earlier, as seen in Figure 5's time series graph using VADER sentiment scores, which failed to capture the extent of polarization or one-sidedness during the discourse. In contrast, the time series graph generated using labels from the stance detection model, displayed in Figure 7, effectively addresses this limitation. Figure 12 reinforces this point by illustrating the stances exhibited for each sentiment category. Notably, supporters of the trend and movie expressed all three sentiments, underscoring the importance of employing NLP techniques capable of understanding context and nuance.
The study builds upon its previous objectives by combining its findings with the socio-political events that occurred during this period to create a comprehensive timeline of events. This timeline strengthens the assumption of trend manipulation. The first research objective highlighted mainstream news media's focus on "The Kerala Story." Word clouds in Figures 1 and 2 reveal that key events threatening government stability were either diluted or conspicuously absent from media coverage. Previous studies have shown that media can lean towards certain political ideologies and intensify partisan bias among viewers. The first event was the civil unrest in Manipur, which included the disturbing incident of two women from a tribe being paraded naked. Action against the perpetrators only occurred after a viral video clip on X sparked widespread outrage, 77 days after the incident. The media's coverage of wrestlers protesting the national sports minister has also faced criticism for bias, with India's Olympic medallists forced to camp in the streets to draw attention to sexual assault complaints against the minister. We then use the metric CTM to investigate manipulation in the discourse that took place through which we see that the values of CTM aligns with those of manipulated trends. The study further explores tweets related to movie discussions, where the stances expressed by the users are analysed revealing high levels of partisanship. There have been instances of political trends being manipulated on X in response to threats to incumbent authorities. The study highlights three key events that could potentially destabilize the government. These events, along with spikes in discussion, are incorporated into a timeline of events (Figure 13) that supports the theory that this trend was manipulated to polarize and divert attention from the shortcomings of ruling political factions.

The findings of this study underscore the importance of understanding the multi-faceted nature of online campaigns and their potential to manipulate perceptions of the public. The investigation into the discussions that arose from the movie ‘The Kerala Story’ revealed patterns of manipulation, which, though not entirely unexpected provides important insights into strategies employed by certain actors to shape narratives and divert attention from pressing socio-political issues.
The source code for this project can be be found here.